Taking Nature's Pulse: Section 3: Threats to Biodiversity in B.C.
3. Threats to Biodiversity in British Columbia
Biodiversity is under threat around the world. The 2005 Millenium Ecosystem Assessment estimated that 60% of the world's grasslands, forests, farmlands, rivers and lakes have been degraded, along with their ability to perform essential ecosystem functions and to support life.800 Although the World Conservation Union (IUCN) monitors only a fraction of the world's 1.5 million scientifically described species, its assessment suggests that a significant proportion of species are of conservation concern. The global extinction rate is estimated at 100 to 1,000 times the natural background rate of extinction and may increase by 100-fold in the future.801 Lost along with each species is its current and evolutionary potential to provide food, fuel, building materials, pollination, decomposition or other services essential to maintain life for all organisms, including humans.
Generally, ecosystem integrity in British Columbia has remained relatively high due to the province's short history of development and mountainous terrain. However, the current trends for both species and ecosystems are of major concern. Where biodiversity intersects with the ever-increasing human use of land and resources, species and ecosystems have suffered.802 Within B.C., 43% of the assessed species are of provincial conservation concern (see Table 13, p. 54). Also of provincial conservation concern are four of the 16 biogeoclimatic zones (see Table 3, p. 32), four of the nine Major Drainage Areas (see Table 9, p.43) and 340 (56%) of the 611 described ecological communities (see Table 7, p. 38). The status of biodiversity at the genetic, species and ecosystem levels in B.C. indicates that all is not well. 155
The past 4,000 years of relative ecological stability was disrupted by the arrival of European and Asian settlers. Ecosystems that took thousands of years to develop have been disturbed, especially in the southern part of the province, by land conversion, widespread logging, dams and alien species. Not since the last ice age, 10,000 years ago, has such a change in biodiversity occurred in the province.
3.1 Approach
This section describes the impacts (past and current) and threats (future) to biodiversity in the freshwater and terrestrial realms and the overlap with the marine realm (estuaries and intertidal areas). A special emphasis is placed on climate change. Information on trends is presented where available. Where quantitative information was limited or not available, qualitative data based on professional judgements were incorporated into the assessment.
Since a consistent framework for measuring impacts in B.C. does not exist, a framework (Figure 31) was created based on input from a 2006 survey of 25 B.C. experts (referred to below as the 2006 biodiversity threats survey) and the IUCN classification of the major international threats to biodiversity.803 The general concept underlying this framework is that there are multiple human activities (e.g., forestry, grazing) that culminate in a number of stresses (e.g., ecosystem conversion) and impact the elements of biodiversity, resulting in consequences such as loss of diversity or habitat fragmentation. Two main sources of information were used to determine the magnitude of, and relationship between, human activities and stresses. Both involved the observation of impacts as reported through opinion surveys and workshops: the 2006 biodiversity threats survey804 and a 2003 assessment of threats.805 Supplementary information was obtained from documents relating to impacts and threats to biodiversity in B.C.
Section 3 includes an examination of the main stresses (ecosystem conversion, ecosystem degradation and alien species) and the three lower-ranked stresses (environmental contamination, species disturbance and species mortality), followed by a discussion of the human activities that contribute to them. Most of the discussion (e.g., information and trends) focuses on the stresses and human activities that have the highest impact on biodiversity, according to the surveys.
3.2 Major Stresses on Biodiversity
Many of the declining trends presented in Section 2 are the result of two factors: ecosystem conversion and ecosystem degradation. For example, many streams in the Lower Fraser Valley have been lost to draining and culverting (see Text box 7, p. 43), grasslands have been converted to farms and urban centres (see Text box 5, p. 39), old-growth forests have been converted to early seral stages, and mountain caribou range in southern B.C. has been fragmented leading to substantial population declines and extirpations (see Text box 13, p. 85). Ecosystem conversion and degradation are prevalent in all four of the biogeoclimatic zones of conservation concern (see Table 3, p. 32).806
Figure 31: The biodiversity threat framework.
A third factor often cited for its effect on biodiversity is alien species invasion - often a secondary impact that follows ecosystem degradation.807, 808 Alien species are outcompeting many rare native plants in Garry oak ecosystems on Vancouver Island (see Text box 6, p. 40) and dominating grasslands in the Okanagan.809 The number of alien species of vascular plants and freshwater fish in the province continues to increase,810 with many of them having serious impacts on biodiversity.
The 2007 B.C. environmental trends report assessed six broad-scale stresses facing 179 of B.C.'s species of conservation concern and concluded that the top two were habitat loss (defined as a combination of habitat conversion and degradation) and alien species.811 Similarly, the 2006 biodiversity threats survey identified the three major stresses on biodiversity in B.C. as ecosystem conversion, ecosystem degradation and alien species, based on the level of concern for genes, species and ecosystems in both the terrestrial and freshwater realms (Figure 32). Stresses rated as being of lesser concern were environmental contamination, species disturbance and species mortality. All of these can have consequences for biodiversity, such as loss of species, decreases in population size and distribution, loss of connectivity and ecosystem resilience, or compromised ecosystem processes and function.
The identification of ecosystem conversion, ecosystem degradation and alien species as the most significant stresses on biodiversity in B.C. is consistent with national and international findings. Ecosystem conversion and degradation have been identified by national and international studies as the most significant immediate stresses on biodiversity.812, 813, 814, 815 In addition, alien species have emerged as an increasing threat to native species and ecosystems around the world.816
Losses to biodiversity usually originate from more than one source. Multiple stresses can impact biodiversity at a magnitude greater than the sum of the individual stresses, can be cumulative over time and can trigger cascading impacts on other components of biodiversity. For example, B.C. is experiencing rapid climate change; we do not know the exact magnitude and extent of the threats to biodiversity, but impacts that have been observed already suggest that the stresses will be significant.817, 818 Climate change will have its greatest impact in areas of the province where biodiversity has already been affected by other factors such as ecosystem degradation or alien species. Future ecosystems may or may not re-assemble into the same form as in the past, and the speed at which plants and animals adapt to or move with changes in conditions will determine whether they thrive, decline or disappear.819 Where the landscape has already been degraded and fragmented, habitat connectivity may be lost, resulting in species being unable to move in response to the changing climate. This may have a more significant impact on species that are restricted to freshwater ecosystems (e.g., fish), as they have fewer opportunities than terrestrial species for shifting their ranges.
In the 2006 biodiversity threats survey, the experts identified ecosystems as being of higher concern than species and genetic-level diversity in both realms, and expressed slightly higher concern for biodiversity in the freshwater realm than in the terrestrial realm.
3.2.1 ecosystem conversion
Ecosystem conversion is one of the greatest stresses on biodiversity in B.C.820 Ecosystem conversion is the direct and complete conversion of natural landscapes, such as forests, wetlands or grasslands, to landscapes for human uses (e.g., buildings, houses, parking lots, agricultural fields).821 Ecosystem conversion or loss compromises or eliminates the ability of native species to survive in the new conditions and they either adapt, move or die. The result is reduced species richness and the loss of ecological functions such as air and water purification, pollination, soil building, climate regulation, and nutrient and water cycling. These functions performed by plant and animal species are essential for ecosystem health and for human well-being.
The magnitude of ecosystem conversion in B.C. varies spatially. In the terrestrial realm, there has been significant ecosystem conversion in the Coastal Douglas-fir biogeoclimatic zone on the southeast coast of Vancouver Island and in the Bunchgrass and Ponderosa Pine zones in the southern interior (Table 25), all three of which are of conservation concern (see Section 2.1.1.1, p. 30). Although only about 2% of the province's land base has been converted, the conversion is concentrated in these three rarest biogeoclimatic zones. In other parts of the province, the pattern of conversion follows the lower-elevation transportation corridors, with areas of loss concentrated around population centres. The province's mountainous topography has limited human activity and ecosystem conversion in high-elevation areas, but lower areas, such as valley bottoms and coastal regions, have been significantly impacted; 94% of ecosystem conversion in B.C. has occurred below 1,000 m elevation (Map 12).
Figure 32: Impact of stresses on elements of biodiversity.
Source: Long, G. 2007. Biodiversity Safety Net Gap Analysis. Biodiversity BC, Victoria, BC. 66pp. Available at: www.biodiversitybc.org.
Note: For this analysis, 25 B.C. experts identified the relative contribution of each of the six impacts by allocating 100 points amongst the six realm/level combinations.
In the Okanagan Valley and Fraser River delta, more than 75% of the wetlands have been converted by agriculture, urbanization and commercial activities.822, 823 In the freshwater realm, extensive conversion also comes from reservoirs, which can eliminate natural ecosystems such as wetlands. Activities that result in ecosystem conversion in the overlap between the terrestrial and marine realms include shoreline armouring (e.g., retaining walls) and the diking, draining or filling of estuaries.
Table 25. Area Of Terrestrial Ecosystem Conversion In B.C. Since European Contact.
| Biogeoclimatic Zone | Conservation Status | Total Land Area Before Ecosystem Conversion (Km2) | Area Of Ecosystem Conversion(Km2) | Area Of Ecosystem Remaining (Km2) | Percent Of Land Area Converted To Human Uses |
| Coastal Douglas-fir | Imperilled (G2) | 2,561 | 1,251 | 1,310 | 49% |
| Bunchgrass | Imperilled (G2) | 2,579 | 531 | 2,048 | 21% |
| Ponderosa Pine | Imperilled/vulnerable (G2/G3) | 3,513 | 617 | 2,896 | 18% |
| Interior Douglas-fir | Vulnerable (G3) | 42,721 | 2,302 | 40,419 | 5% |
| Boreal White and Black Spruce | Apparently secure (G4) | 159,473 | 6,106 | 153,367 | 4% |
| Sub-boreal Spruce | Apparently secure (G4) | 95,551 | 3,206 | 92,345 | 3% |
| Coastal Western Hemlock | Apparently secure (G4) | 104,998 | 2,745 | 102,253 | 3% |
| Interior Cedar-Hemlock | Apparently secure (G4) | 51,751 | 837 | 50,914 | 2% |
| Sub-boreal Pine-Spruce | Apparently secure (G4) | 22,643 | 284 | 22,359 | 1% |
| Montane Spruce | Apparently secure (G4) | 27,996 | 201 | 27,795 | 1% |
| Engelmann Spruce-Subalpine Fir | Secure (G5) | 170,564 | 200 | 170,364 | <1% |
| Mountain Hemlock | Apparently secure (G4) | 36,590 | 18 | 36,572 | <1% |
| Spruce-Willow-Birch | Apparently secure (G4) | 80,131 | 30 | 80,101 | <1% |
| Boreal Altai Fescue Alpine | Secure (G5) | 76,828 | 17 | 76,811 | <1% |
| Interior Mountain-heather Alpine | Secure (G5) | 17,682 | 1 | 17,681 | <1% |
| Coastal Mountain-heather Alpine | Secure (G5) | 52,000 | 3 | 51,997 | <1% |
| Provincial total | 947,581 | 18,349 | 929,232 | 2% |
Source: Prepared for this report.
Note: Based on imagery taken between 1991 and 2001; ecosystem conversion that occurred after the images were taken is not included.
3.2.2 ecosystem degradation
Ecosystem degradation is change to the structure of a natural system (e.g., through forest harvesting or water diversion), impacting an ecosystem's composition and function. This can take many forms, including habitat fragmentation, reduction in the quality or extent of habitat, or alteration of water flow.
The alteration of one component of biodiversity can set off a cascade of effects on other species and ecosystems. For example, fire suppression in an area of mixed forest and grassland allows the incursion of trees into the grassland, reducing the extent of the latter ecosystem.824 At some point, the grassland may become too restricted for many of its species to survive. The increased forest encroachment could also modify the structure and composition of its predator community, resulting in increased predation on grassland species. In streams, an increase in the withdrawal of water can increase the temperature and reduce the ability of fish species to survive. The reduction in stream flow could delay the entry of salmon into the stream to spawn, exposing them to marine predators for a longer time and reducing the prey base for terrestrial predators and scavengers. Other causes of degradation include livestock grazing, damming of rivers, logging, installation of fences and road building. Degraded ecosystems are more vulnerable to invasion by alien species and to the spread of disease.825
Ecosystem degradation occurs throughout B.C. For example, the increasing allocation of water from streams for human uses (Figure 33) affects natural stream hydrology.826 About 97% of water licensed in British Columbia is for power production, including storage. The remaining 3% is licensed for consumptive uses such as industrial, commercial and agricultural activities and drinking. The Bennett Dam on the Peace River, completed in 1967, created the largest body of fresh water in B.C., the Williston Reservoir.827 It converted large parts of the Finlay and Parsnip rivers from a network of streams and rivers to a single water body, with devastating effects on Arctic grayling populations.828 Within two years of the dam's completion there were impacts downstream, including reduced peak flows and a 28% decrease in the number of small lakes and wetlands. Also downstream, the Peace-Athabasca delta in northeastern Alberta, one of Canada's most productive and diverse marsh and wetland habitats, was significantly reduced in size, demonstrating the effects of actions in B.C. on biodiversity in other jurisdictions.829
Figure 33: Streams allocated to human uses, 1950s-2001.
Source: B.C. Ministry of Water, Land and Air Protection. 2002. Trends in Water Allocation Restrictions Across British Columbia. In Environmental Trends in British Columbia 2002. State of the Environment Reporting Office, Victoria, BC. Available at: www.env.gov.bc.ca/soerpt/8surfacewateruse/allocations.html.
Notes: 0 = licenses present on the stream, but no restrictions. No licenses = no licences present on the stream. Values are the percentage of stream length fully allocated to human uses.
Various stresses can combine to increase the magnitude of ecosystem degradation. This concept of cumulative impacts is based on the idea that while a single impact may not be notable, the combination of additional impacts can result in a significant stress on the system. In the face of multiple impacts, ecosystem resilience will decline until the ecosystem no longer has the ability to rebound and to provide the functions it once did.
The Nicola River case study (Text box 18) illustrates the cumulative impact of multiple stresses on one freshwater system. This situation is expected to become widespread in the Thompson and Okanagan areas, where licensed water use already removes a high percentage of the flow in many systems during the annual low-flow period and future water demand is expected to increase as a result of climate change and population growth.830
Text Box 18. The Nicola River: Extreme Pressure On Water Resources831
The Nicola River is a tributary of the Thompson River in the Fraser River drainage. The Nicola River drains 7,227 km2 - an area equivalent to one-eighth of the Thompson River drainage - and is a major producer of chinook salmon, coho salmon and steelhead, supporting world-renowned runs of these species.832 Water temperature is recognized as an extremely important variable that can affect the distribution, growth, behaviour, metabolism, disease resistance, survival and productivity of juvenile and adult salmonids.833
Water temperatures in the Thompson River are inherently susceptible to warming trends during the summer months due to regional climatic conditions.834 Summers are characteristically hot and dry and air temperatures can exceed 40°C. Annual precipitation ranges from 250-500 mm per year.835 High demand for water by the agricultural, industrial and domestic sectors exacerbates this natural susceptibility by decreasing flows and increasing extreme temperature fluctuations.836 In addition, removal of riparian vegetation decreases shading and can increase channel width. Individually and collectively, these changes can elevate water temperatures in many situations.
Fisheries and Oceans Canada conducted temperature monitoring during 1994-1996 in the Nicola River watershed.837, 838, 839 The study revealed temperatures frequently within the ranges considered unsuitable or lethal to salmonids. The preferred range for salmonid spawning is 4-14°C. Spawning ceases and disease increases at water temperatures above 16°C, and at 21-25°C, temperatures become lethal to salmonids. 1994 was the hottest year during the study, with average mid summer temperatures exceeding 21°C at almost all sites. At two sites on July 24, 1994, maximum recorded temperatures reached 29°C, well above the lethal tolerance range for Pacific salmonids. The total time above 25°C in 1994 ranged from 33 to 93 hours, with the maximum consecutive periods above 25°C ranging from 9 to 18 hours. While the temperatures measured in 1995 and 1996 were cooler, the temperatures were still stressful and even lethal to salmonids.
In addition to the commercial, recreational and First Nations fisheries supported by the Nicola River system, extensive forestry and agriculture takes place in the Nicola drainage. More than 26% of the watershed has been logged,840 and agricultural activity is intensive and concentrated along the lower, more productive reaches. Upland areas are used for summer grazing and the valley bottoms are used for winter cattle feeding. There are at least 1,600 water licenses in the Nicola River watershed and 95 restrictions, many of them in place since as early as 1991.841 More than 560 km of stream length in the watershed has been allocated to licenses and over 20% of that stream length has been restricted.842 In addition, development is concentrated along the Coldwater River, a major tributary of the Nicola River.
The Nicola River situation highlights how a natural vulnerability - in this case, to temperature increases - can be severely exacerbated by a combination of climate change and resource development (e.g., loss of shade and water flow) to the point that ecosystem viability and the sustainability of major fish populations are seriously threatened.
3.2.3 Alien Species
Alien species are those that occur outside their native range due to human introduction. 843 Alien species can be introduced intentionally (e.g., through agriculture, horticulture, forestry or the release of pets), accidentally (e.g., contamination on plants, species attached to equipment that is transported) or from captive or commercial cultivation (e.g., zoos, farmed animals, escapes from research facilities).844 Species that are native to some parts of B.C. can be alien species when moved to other areas of the province (e.g., raccoons, beaver and deer are alien species on Haida Gwaii/Queen Charlotte Islands). For the purposes of this report, species that are native to neighbouring jurisdictions and shift their distributions due to climate or habitat change are not considered alien species.
Not all alien species are harmful because most cannot spread; invasive alien species are those species that threaten biodiversity. One estimate is that about 10% of alien species become invasive.845 However, some species also exhibit a time lag between introduction and impact on biodiversity. For example, gorse (Ulex europaeus) was introduced to B.C. at least 90 years ago,846 and was only recently recognized as an invasive alien species.a Invasive alien species alter forest fire cycles, nutrient cycling, hydrology and energy budgets in native ecosystems.847 They displace native populations of plants and animals by occupying habitat and competing for resources.848 Alien species can also affect native species through predation, displacement, habitat degradation (e.g., removal or replacement of vegetation), hybridization and the introduction of diseases, as well as by facilitating the spread of other non-native species.849 Sometimes alien species are introduced to perform beneficial ecological roles, such as in the case of species introduced for biological control. For example, the beetle Galerucella calmariensis has been introduced to some areas to control purple loosestrife (Lythrum salicaria).
In B.C., some of the most vulnerable ecosystems include the grasslands of the interior, where invasive alien species such as purple loosestrife and European starlings (Sturnus vulgaris) reduce the abundance of native species, and grazing, road building and fire suppression have facilitated the spread of alien plant species such as cheatgrass (Bromus tectorum). On some of B.C.'s coastal islands, ecosystems have been degraded by alien species such as rats, racoons, deer and European rabbits (Oryctolagus cuniculus). In the urban areas of the lower mainland and Vancouver Island, the introduction of European herbaceous species, in conjunction with fire suppression, has altered the Garry oak ecosystem as well as many of the wetlands.850 In streams, the release of species such as yellow perch (Perca flavescens) has reduced native trout populations through competition and predation.851 Once established, invasive alien species can be extremely difficult and costly to control or eradicate, with knapweed (Centaurea spp.) being a good example of this problem in B.C.852
a Gorse was added to the provincial list of noxious weeds in 1996.
The B.C. Conservation Data Centre lists 809 alien species.853 Most are vascular plants, but the inventory of many alien insects, such as beetles, true bugs and plant lice, is incomplete, and the abundance of alien insects in other areas already far exceeds that of alien vascular plants.854, 855, 856 The number of alien vascular plants identified in B.C. increased by 29% between 1994 and 2006 (Figure 34).857 Alien freshwater fish species increased by 300% between 1950 and 2007, rising from seven species to 21 (Figure 34),858, 859 and the number of water bodies hosting alien fish species increased from 28 to 625 between 1950 and 2005.860 Note that the increase in detections of alien species is a function of both actual introductions and better information.
Map 13 shows the distribution of the 776 terrestrial and freshwater alien species of vertebrates, invertebrates and vascular plants for which location data were available.861 The biogeoclimatic zones with the highest numbers of mapped alien species were the Coastal Western Hemlock (579 species), Coastal Douglas-fir (515) and Interior Douglas-fir (335) zones.
Figure 34: Alien vascular plant and freshwater fish species in B.C.
Source: B.C. Ministry of Environment. 2007. Species Conservation. Technical Paper for Environmental Trends 2007. State of Environment Reporting Office, Victoria, BC. Available at: www.env.gov.bc.ca/soe/et07/07_species_conserv/technical_paper/species_conservation.pdf; and D. McPhail, University of British Columbia, Emeritus, personal communication.
Note:* Years with no data available.
Text Box 19. Aquaculture Of Manila Clams In Intertidal Areas862
The Manila clam (Tapes philippinarum) is an interesting example of an alien species that has become commercially important and is threatened by impacts on intertidal biodiversity, yet also potentially threatens intertidal biodiversity. Accidentally introduced into B.C. from Japan with the seed of the Pacific oyster (Crassostrea gigas) in the early 1900s, the Manila clam has become the most important commercial wild-harvested clam species in the province.863 High concentrations of clam leases occur in some areas, such as Baynes Sound. There is a poor understanding of the cumulative effects of high densities of clam tenures combined with secondary impacts such as water quality changes, other alien species and climate change.
A number of approved activities associated with Manila clam production present threats to intertidal biodiversity.
-
Substrate modification: Manila clams grow and survive best in a stable, loosely packed substrate of gravel, sand, mud and shell. To enhance natural substrate that is inadequate for Manila clam production, gravel or a combination of gravel and crushed oyster shell is spread on beaches, which likely affects the structure of benthic communities.
-
Beach modification: To enhance substrate stability and protect clam pots from storm damage, predator-exclusion netting and berms are used to reduce wave energy. Other methods used to stabilize beaches for clam production include contouring the intertidal area and channelizing streams that flow through the plots. All of these practices may alter the natural patterns of waves and currents and result in impacts on the natural patterns of erosion and sedimentation in the intertidal zone.
-
Predator control: Predation on clams by bottom fish, crabs, starfish and sea birds is controlled by the application of protective netting over seeded substrate. The removal and destruction of these predator species may shift the intertidal community to one primarily made up of clams.
-
Maintenance: Terrestrial vehicles are sometimes used to spread gravel on beaches, move material into place or retrieve bags of clams or materials. Significant human activity takes place on beaches during site preparation and seeding, often at low tides. Vehicles compact substrate and alter drainage and sediments, impacting the intertidal vegetation and fauna such as
3.2.4 environmental contamination
Environmental contamination occurs when substances are released intentionally, accidentally or as a by-product, into natural systems. They may be transported through air, water or soil and can be emitted from specific sites (point source) or through more diffuse sources (nonpoint source), such as runoff from land. Contaminants can accumulate in various ways: within an organism (i.e., through ingestion); at progressively higher levels within a food web, as predators consume prey; or in particular geographic areas before being released into other ecosystems. For example, airborne contaminants can accumulate in the snow that feeds lakes in the Rocky Mountains, resulting in concentrations high enough to affect wildlife at the top of the food chain.864
Traditionally, the list of contaminants included metals (e.g., mercury, lead, copper, zinc), but more recent additions include: persistent organic pollutants (POPs), which include a wide range of chlorinated and other halogenated chemicals, such as dioxins, furans, polychlorinated biphenyls (PCBs) and polybrominated diphenyl ethers (PBDEs); fine particulate matter emitted from vehicles, factories and power plants; various types of pharmaceuticals, herbicides and pesticides; sewage effluent; and nitrogen, phosphorus or other nutrients from sources such as fertilizers.
The impact of a contaminant on a species or ecosystem depends on the amount of exposure and its toxicity and persistence. Effects may be lethal (i.e., the contaminant kills organisms) or sublethal865 (e.g., it impairs reproduction or degrades ecosystems). Several POPs have been identified as endocrine-disruptors that interfere with hormones, resulting in feminization of male animals, masculinization of females, eggshell thinning in birds, and disruption of vitamin A and thyroid hormone physiology in mammals.866 Sources of these substances have been found in sewage and pulp mill effluent and in pesticides.867
Shellfish beds in coastal B.C. are closed to harvesting when samples show contamination with bacteria (fecal coliforms) from human or animal wastes. Sources of contamination include urban runoff, sewage discharge and agricultural drainage. Closures of shellfish beds have increased since the 1970s owing to increases in human population and associated increases in the discharge of sewage (Figure 35). Increases in closures can be attributed to better monitoring for contamination, but also indicate increases in shoreline development. The sharp increase in 2001 resulted from a temporary closure in Clayoquot and Barkley sounds, likely the result of contamination from wildlife wastes that had been washed into the ocean by heavy rains. Closures to protect human health also indicate that there may be deleterious effects on other life forms.868
After the recognition of the impacts of POPs, many were banned or subject to stringent regulations, which have controlled their use and release since the 1970s. As a result, levels of many POPs have decreased substantially, but because of their low rate of decomposition, they remain in the environment and continue to circulate.869 Levels of some other POPs have not decreased. PBDEs, which are used as flame retardants in consumer products, have generally increased. While one form used in polyurethane foam has decreased, many others used in the production of plastics (e.g., carpet backings, electrical insulation, computer and TV cases and other consumer goods) have increased.870 This is reflected by an almost tenfold increase in the amount of PBDEs in the breast milk of Vancouver women between 1992 and 2002, from 3 ng/g to 20 ng/g.871 The amount of dioxins and furans emitted from pulp mills has decreased, but substantial amounts of sulphur compounds are still being emitted into the air.872 While many metals are no longer emitted, there are still detectable levels in the environment from past events (see Section 3.3.11, p. 209).
Figure 35: Trends in shellfish beds closed to harvesting in British Columbia, 1989-2006.
Source: Environment Canada. 2005. Shellfish Closures: An Indicator of Contamination in Marine Ecosystems in BC. Ecosystem Information Section. Available at: www.ecoinfo.org/env_ind/region/shellfish/shellfish_e.cfm.
3.2.5 Species Disturbance
Species disturbance is the alteration of the behaviour of species due to human activities, including those that result in the movement of physical objects or that create or alter sounds, sights, smells or other sensory stimuli. Examples include aircraft flying close to mountain goats, dogs chasing waterfowl, and power lines causing birds to modify flight patterns. Transportation and recreation are major causes of disturbance.
Disturbance can result in indirect mortality (increased risk of death), lowered productivity, or reduced use or abandonment of an area.873 Some species may become habituated to disturbance (e.g., ungulates grazing near a highway), but their risk of mortality may increase through direct mortality or predation. Predation can increase when structures provide camouflage or better access via trails, such as when wolves follow packedsnow trails to gain access to mountain caribou herds.874 In the intertidal zone, predator control nets used to reduce the loss of harvestable shellfish can have the unintended effect of excluding waterfowl from intertidal feeding habitats.875
In 2002, disturbance was rated as the seventh greatest threat (out of nine) to species of highest conservation concern in B.C.876 Many species in B.C. are sensitive to human disturbance (e.g., wolverines, grizzly bears, mountain goats and mountain caribou.) For some species, disturbance is most significant at certain times of the year. One study of brant, which stage in intertidal areas at Parksville and Qualicum Beach during spring migration, rated human-associated disturbance (by people, dogs and boats) as the highest cause of disturbance at 39%, followed by natural disturbance by birds of prey at 33%.877
3.2.6 Species Mortality
Species mortality is the direct killing of individuals either intentionally (e.g., harvesting, poisoning) or unintentionally (e.g., by-catch, road kill). In 2002, it was rated as the sixth greatest threat (out of nine) to species of highest conservation concern in B.C.878 Though rated lower than other stresses on biodiversity, species mortality results in the direct reduction in population size. It can occur on a large scale (e.g., fishing, hunting) or on a smaller scale (e.g., pest removal). The direct loss of individuals at a large scale can reduce a species or population below a minimum population threshold, thus reducing its chance to maintain a viable population size. Some forms of species mortality (e.g., removal of plants) can create other stresses such as ecosystem degradation.
3.3 Human Activities Impacting Biodiversity
In Section 3.2, the major stresses on biodiversity in B.C. were identified as ecosystem conversion, ecosystem degradation and alien species. Section 3.3 examines the human activities in various economic sectors that contribute to these stresses. Note that it is not the sectors, but some specific practices undertaken within these sectors, that impact biodiversity.
People require products derived from nature such as food, water, wood, electrical power and soil to survive and to enjoy life. As populations increase, more natural resources are sought. Cities expand to house the increasing population, agriculture intensifies to grow enough food, more power generation is required to produce adequate electricity and more roads are built to transport goods and people. Because people and nature exist together on the same land, each of these human endeavours has the potential to contribute in a large or small way to those things that threaten biodiversity. Road construction can fragment habitat and increase access to wilderness areas; urban expansion can result in paving of riparian areas, draining of wetlands and polluting of streams; and agricultural practices can displace native species and divert water from sources used by aquatic species.
As illustrated in the Nicola River case study (see Text box 18, p. 164), stresses on biodiversity most often originate from multiple human activities with cumulative impacts that can have cascading effects.879 Depending on the type of ecosystem, the climatic conditions or the particular aspect of biodiversity, the stresses can vary in geographical extent, magnitude, duration or persistence. A 2003 province-wide survey of almost 300 biodiversity experts identified which human activities were considered the most significant within the terrestrial and freshwater realms and the marine overlap with these two realms (Table 26).880 In the terrestrial and freshwater realms, climate change was ranked highest, while harvest was considered the greatest threat to biodiversity in the overlap with the marine realm. The analysis also ranked forestry, agriculture, dams, rural and urban development, oil and gas, and recreation as being among the human activities that most impact biodiversity in B.C.a
a The 2003 survey used different terms and methods than the Biodiversity Threat Framework (see Figure 31, p. 157).
Table 26. 2003 Provincial Overview Of Top 10 Human Activities Impacting Biodiversity In B.C.
| Terrestrial Realm | Freshwater Realm | Marine Overlap |
| Climate change | Climate change | Harvest (commercial, recreational, illegal) |
| Forestry (Crown land) | Forestry (Crown land) | Climate change (sea level change, hydrological changes) |
| Alien species | Rural development | Alien species |
| Recreation | Dams | Aquaculture |
| Dams | Alien species | Transportation/corridors - ocean traffic |
| Forestry (private land) | Agriculture | Forestry - ocean/lake log handling |
| Oil and gas | Forestry (private land) | Rural development |
| Grazing | Transportation | Oil and gas |
| Harvest | Recreation | Urban development |
| Rural development | Harvest | Recreation |
Source: Holt, R.F., G. Utzig, M. Carver and J. Booth. 2003. Biodiversity Conservation in BC: An Assessment of Threats and Gaps. Unpublished report prepared for B.C. Ministry of Environment, Biodiversity Branch, Victoria, BC. One of the criteria for the assessment of conservation status for biogeoclimatic zones presented in Section 2.2.1.1 (p. 30) was the level of impact to each zone from 11 different categories.a, 881 The results showed that climate change, residential development and agriculture are major contributors to ecosystem conversion and degradation in all four of the biogeoclimatic zones of conservation concern. Transportation, fire suppression, logging, energy and mines are also significant contributors to impacts in these zones.
Trends reported in Sections 2 and 3 also provide insights into the human activities impacting biodiversity in B.C. For example, the loss of Garry oak ecosystems on southern Vancouver Island (see Text box 6, p. 40) and grasslands in the Okanagan (see Text box 5, p. 39) are primarily the result of agriculture and urban and rural development. A systematic analysis of 179 B.C. species of conservation concern in 2007 identified urbanization, agriculture and human disturbanceb as the greatest contributors to ecosystem conversion and degradationc for these plants and animals.882
For the 2006 biodiversity threat survey, the 25 experts ranked their level of concern for 12 different human activities that potentially impact elements of biodiversity.883 The survey identified climate change, agriculture, forestry, urban and rural development, transportation and utility corridors, water development, and oil and gas development as the activities of highest concern (Figure 36).
a Based on the IUCN categories of threats to biodiversity: residential development, agriculture, energy and mines, transportation, biological resource use, human intrusion, natural systems modification, invasives/problem species, pollution, geologic and climate change.
b Including recreation, tourism, military activities, research, transport, vehicle and vessel traffic.
c The term used in the study was habitat loss, which included both ecosystem conversion and ecosystem degradation. threats to biodiversity in british columbia 173
Taken together, these studies suggest that the human activities that most contribute to the three major stresses on biodiversity in B.C. are climate change, agriculture, recreation, urban and rural development, forestry, transportation and utility corridors, oil and gas development and water development. Climate change is expected to be the greatest overriding threat to biodiversity in the future, although the full extent of its impact has not yet occurred.884, 885, 886
3.3.1 Climate Change
Climate is the primary factor enabling and shaping the distribution of organisms and the nature and character of ecosystems,887 and is therefore a key driver of biodiversity. Climate is defined as the 'average weather' over a period of time, the standard interval being 30 years.888 Temperature and precipitation, measured monthly, seasonally and annually, are used to represent climate. Global and regional climates vary over millennia, usually changing gradually, but at times, especially during glacial conditions, shifting rapidly (see Section 1.4, p. 15).
Figure 36: Impact of human activities on elements of biodiversity.
Source: Long, G. 2007. Biodiversity Safety Net Gap Analysis. Biodiversity BC, Victoria, BC. 66pp. Available at: www.biodiversitybc.org.
British Columbia has experienced at least 4,000 years of relatively stable climate, leading to the current pattern of ecosystems.889, 890
Rapid climate change is underway in response to human greenhouse gas (primarily CO 2) emissions. 891 The United Nations Intergovernmental Panel on Climate Change (IPCC) reports that the average global surface temperature has increased by nearly 1°C over the past century and is likely to rise by another 1.4-5.8°C by 2100.892 A warming atmosphere affects all aspects of the climate system: air pressure and composition of the atmosphere; the temperature of surface air, land, water and ice; the water content of air, clouds, snow and ice; wind direction and speed; ocean currents; ocean temperature, seawater density and salinity; physical processes such as precipitation and evaporation; and the frequency and duration of extreme events. The resulting future climates will be unprecedented in the past 750,000 years.893 The precise amount of warming and associated changes are uncertain. Nevertheless, significant warming has already taken place in northwestern North America where changes are expected to occur faster and be more pronounced than the global average.894
Organisms are sensitive to change in climate and in particular the weather it implies, although individuals, species and ecosystems can tolerate some climatic variation. Future climates are expected to exceed biological tolerances for many species and ecosystems in B.C., leading to widespread effects on biodiversity.895, 896, 897 If greenhouse gas emissions continue at present-day rates, key global considerations for biodiversity based on observed trends and climate change impact models are: 898
-
Ecosystems will probably exhibit a wide range of vulnerabilities to climate change because of ecosystem-specific critical thresholds.
-
The resilience of many ecosystems is likely to be compromised, especially when associated with environmental contamination, unsustainable resource exploitation and land-use change.
-
20-30% of animal species currently assessed are likely to experience high risk of extinction with 2-3°C of warming.
-
Substantial changes will occur in the functioning and structure of terrestrial, freshwater and marine ecosystems with 2-3°C warming.
Most B.C. ecosystems are at high risk from impacts due to climate change.899, 900, 901 Notably vulnerable ecosystems that are well represented in the province include boreal forests and mountain ecosystems. Some ecosystems may tolerate a level of future climate change and persist or have an ability to adapt. Others may threats to biodiversity in british columbia 175 cross critical thresholds to ecologically novel states. The response of species (e.g., via shifting distributions) may occur at intermediate time scales (from months to centuries), while the response time of the biosphere may be on the scale of centuries or possibly millennia.
Biological responses to changing climates have been widely detected.902 In North America, several trends indicate that species, ecosystems and biodiversity-related phenomena are already showing effects of climate change, such as: 903
- Vegetation responses: earlier green-up, bud burst and flowering.
- Wildlife responses: earlier breeding; changes in migration patterns; range changes; mortality.
- Insect responses: B.C.'s mountain pine beetle outbreak.
- Fire responses: increased length of fire season; larger area burned.
- Precipitation responses: earlier snow melt; more rain instead of snow.
Insect distribution and phenology are particularly good indicators of climate change and are already showing responses to changing temperatures and precipitation patterns in the northern hemisphere.904 Butterflies have proven especially sensitive; for example, shifts in the distribution of Edith's checkerspot (both northward and to higher elevations) are well demonstrated in western North America.905 In B.C., the rapid expansion and intensification of the mountain pine beetle infestation demonstrates clearly that warming of winter minimum temperatures and lengthening of the growing season not only affect the distribution and abundance of an insect, but can have resulting widespread effects on ecosystems.906
Warming temperatures have also affected vertebrates in British Columbia. For birds, changes include earlier arrival and later departure of migrants, increases in overwintering numbers in some species, northward range expansions and changes in the relative density of some species.907, 908 In the freshwater realm, sockeye salmon migration has been gradually delayed in the Okanagan River since 1970 by warming water temperatures.909 Even a small increase in river temperatures could have profound effects on salmon runs (especially the species that migrate to the upper reaches of rivers like the Fraser), as salmon generally only have sufficient energy reserves to reach their spawning sites910, 911 and increases in temperature can exhaust their energy reserves.912 Warmer stream temperatures may also facilitate the increase of alien species such as the American shad (Alosa sapidissima). The Columbia River population of this introduced anadromous species is estimated to be about 30 million, and a few individuals have been found in the Fraser River. Over the past 50 years, this species has adapted to colder water;913 if it develops a permanent population in the warming Fraser River, it will reduce the availability of plankton for many species.914
Increasing temperature is the primary result of climate change. Previous analyses for British Columbia have shown that temperatures have been rising across the province, with the largest changes in the cold seasons (winter and spring), in nighttime lows, and in those areas of B.C. that have more inter-annual variability.915, 916 Changes in average temperatures can affect the timing of reproduction in plants and animals, timing of species migration, length of the growing season, species distributions and population sizes, and the frequency of insect and disease outbreaks.
Trends in temperature and precipitation reveal major changes that vary by season and by region over the past 100 years or so. These changes are consistent with the direction of changes in the past 30 years (see Maps 14-18, pp. 179-183), specifically:
-
Annual daily minimum and maximum temperatures have warmed in all seasons in all of B.C.
-
The strongest warming on a provincial scale occurred in the winter daily minimum temperature, which rose by up to 5.8°C over a 30-year period. Fall temperatures increased the least (0.75-1.45°C).
-
The changes in maximum daily temperatures vary widely compared to minimum temperatures. Winters in much of the province have warmed strongly, by 1.5-2.9°C, and springs have also warmed. Summer daily maximum temperatures have warmed in the south and north, but have cooled in central B.C., especially on the adjacent coast. Daily maximum fall temperatures have warmed in the south, but in the north have cooled by 0.5-1.5°C.
Previous studies of the magnitude and direction of climate change suggest that precipitation has increased in southern B.C. by 2-4% per decade and that total annual precipitation has increased in many parts of the province, most noticeably in the Okanagan and north coast regions.917, 918 The long-term annual precipitation trend shows a widespread increase of 10-30% per century in most of the province, except the southwest, where little change has occurred. Precipitation has increased in all seasons throughout most of the province, except in the south, where winter precipitation has changed little or even decreased (Map 14). Precipitation analyses demonstrate that broad annual changes mask significant month-to-month variability trends that have the potential to impact biodiversity.
For this report,1971 to 2000 was used as the assessment period.a,919 In this recent interval, warming occurred widely throughout the province during the winter and, as was the case for the 100-year trend, annual minimum daily temperatures increased most in the north and least on the south and central coast. In contrast, maximum daily temperatures rose most on the coast and in the north, and least in the southern interior and southeast. It is important to note that in some areas, such as northern B.C., the absolute rate of change in temperature (e.g., minimum temperature; Map 15) has been large, but relative to the range of natural climatic variation it is less than for the southern part of the province (Map 18). From the perspective of biodiversity and sensitivity of individual species, small average temperature changes in regions of narrow climatic variation (such as in the Coastal Douglas-fir biogeoclimatic zone) may have much more consequence than larger average temperature changes where the climatic variation is greater. Species exposed to large natural variation (as in the Boreal White and Black Spruce biogeoclimatic zone) may have the capacity to tolerate large changes. In general, the greatest relative temperature changes in B.C. are associated with ecosystems of conservation concern (the Coastal Douglas-fir, Bunchgrass and Ponderosa Pine).
a For the purposes of this analysis, it was assumed that most elements of biodiversity will be responding to the most recent changes in climate, hence the use of the 1971-2000 time frame. threats to biodiversity in british columbia 177
For the current modelling approaches, temperature is the most reliable and predictable measure of climate change. Temperature trends may thus be good indicators of those regions or ecosystems with the most potential to change in the future.
3.3.1.1 Future Conditions
Measured trends and observed responses clearly indicate that climate change is underway and that this change will affect biodiversity.920 The degree of change in biodiversity will depend in part on the size and rate of future climate change and its geographic variability. Numerical climate models of atmosphere, ocean and land generate projections that provide insight into future temperature and precipitation trends as greenhouse gas concentrations increase. The outputs from global models vary according to the structure of the model and the atmospheric concentration of greenhouse gasses, mainly CO 2, used in a model. Typically, future conditions are presented as a range of scenarios (low, medium and high) from several models for specific time horizons.
Data from three models and emission scenarios, representing low, medium and high change, show that warming will be well underway by 2020 and that widespread major warming likely will have occurred in B.C. by 2050 (Figure 37).921 By 2080, the potential mean annual temperature increase for all of B.C. is shown to be in the range of 3°C (low-change scenario) to 4.8°C (high-change scenario).922 Results from a slightly different approach, in which values from many models for a range of greenhouse gas emissions are used, reveal similar widespread warming beginning by 2020. By 2080, all regions of B.C. will have warmed by at least 2.5°C (low-change scenario) and some parts, such as the north, by as much as 10°C (high-change scenario). Notably, temperature trends for northern B.C. for the 1971-2000 interval already reveal warming at a rate of 5-10°C per century for minimum daily temperatures.924
Climate models are less capable of anticipating future precipitation than future temperatures. Nevertheless, broad patterns are evident (Figure 38). The mean annual precipitation increase for B.C. is shown to be in the range of 9% (under a low-change scenario) to 18% (under a high-change scenario) by 2080,925 with most of the increase occurring in the winter and decreased precipitation projected for the summer.926
Increases in mean annual precipitation will be evident by 2020. Northern B.C. appears to exhibit the greatest potential for increased precipitation.
The differences across the range from lowto high-change scenarios reinforce the need to explicitly recognize and account for the uncertainties that exist in projections of future climate. That said, the results from data for B.C. are consistent with those reported by the IPCC for the northern hemisphere.927 Maps 14-16 show important seasonal trends and differences that will undoubtedly have key consequences to many elements of biodiversity. For example, for anadromous fish, trends toward decreased autumn and increased winter precipitation on the coast can lead to increased stress, followed by winter flooding and stream erosion with negative consequences for survival. An increase in annual precipitation without an increase in summer precipitation offers little benefit to species that need moisture during the hot, dry season, and summer precipitation is indeed projected to decrease.928
Figure 37: Projected mean annual temperature change for the 2020s, 2050s and 2080s for three climate change scenarios: low, medium and high.
Source: Murdock, T.Q., A.T. Werner and D. Bronaugh. 2007. Preliminary Analysis of BC Climate Trends for Biodiversity. Biodiversity BC, Victoria, BC. 24pp. Available at: www.biodiversitybc.org.
Notes: HadCM3 B22 = Hadley Centre Coupled Model with a low greenhouse gas emission future. CGCMs A22 = Canadian Global Climate Model 2 with an intermediate greenhouse gas emission future. CSIROM2b A11 = Commonwealth Scientific and Industrial Research Organization Model with a high greenhouse gas emission future.
Figure 38: Projected mean annual precipitation change for the 2020s, 2050s and 2080s for three climate change scenarios: low, medium and high.
Source: Murdock, T.Q., A.T. Werner and D. Bronaugh. 2007. Preliminary Analysis of BC Climate Trends for Biodiversity. Biodiversity BC, Victoria, BC. 24pp. Available at: www.biodiversitybc.org.
Notes: HadCM3 B22 = Hadley Centre Coupled Model with a low greenhouse gas emission future. CGCMs A22 = Canadian Global Climate Model 2 with an intermediate greenhouse gas emission future. CSIROM2b A11 = Commonwealth Scientific and Industrial Research Organization Model with a high greenhouse gas emission future.
3.3.1.2 Implications Of Climate Change For Biodiversity In British Columbia
Measured trends and data from models point to unprecedented transformation of global climate that will have major impacts on biodiversity. These impacts will exacerbate non-climate factors related to human activity, such as land-use changes, pollution and resource use.929 Climate trends reported here specifically for B.C., as well as consideration of global climate change patterns, indicate that our region can expect greater-than-average climate change. A comprehensive analysis of the effects of climate change on biodiversity is beyond the scope of this report, but several published studies, as well as unpublished data, provide the basis for a summary.930, 931, 932, 933, 934
Potential climate change impacts can be considered on the basis of information from measured trends, paleoecological studies (see Section 1.4, p. 15), impacts models and a general consideration of the requirements of species and ecosystems.935, 936 Practically, the identification of biodiversity attributes (i.e., populations, species, ecosystems, processes) especially sensitive to climate change provides a basis for selecting key indicators of biodiversity health.
Several key principles need emphasis when considering the potential consequences of climate change for biodiversity:
-
Considering the uncertainty in the magnitude of climate change, it is even more difficult to anticipate the responses of species and ecosystems, most of which are poorly understood.
-
Responses are likely to be complex, involving interspecies relationships and critical thresholds.
-
Ecosystems do not migrate; species do, and they may or may not re-assemble into the same ecosystems as in the past.
-
The rate of climate change will exceed the ability of most species to migrate and adjust their range to new conditions.
-
Many species, especially those of old-growth ecosystems, will likely undergo population and range reduction and experience serious declines to levels that may be too low for recovery before they are able to expand into new regions.
-
Extreme climatic events will punctuate more gradual changes, leading to unanticipated ecological changes, including extinction.
-
Expansion of alien species' ranges may be to the detriment of native species.
-
Regions of high natural climatic variability may have greater natural resilience than those with low natural variability.
Potential impacts at the provincial level can be readily appreciated by comparing projected gains and losses in the climate envelopea for each biogeoclimatic zone (Figure 39). By 2085, only 22% of the province will still have the same zonal climate envelope that it had in 1995.937 By 2085, the climate envelopes for the Ponderosa Pine, Interior Cedar-Hemlock, Interior Douglas-fir, Bunchgrass and Coastal Douglas-fir zones will increase. However, while these zones will increase in extent, their condition may not necessarily remain or improve. These zones may experience a loss of resilience, increase of alien species or expansion of other ecosystems (e.g., deserts from southern regions in the United States).938
Figure 40 shows the shift in climate envelopes from the present to 2085, represented by biogeoclimatic zonal climates.b Climate envelopes can predict potential vegetation changes, but they cannot anticipate the speed at which species can migrate or the disturbance events that will potentially cause a shift to a new ecological community. As well, in the absence of suitable soils, vegetation will not become established regardless of the climate.
Figure 39: Climate envelopes for biogeoclimatic zones in B.C.: current distribution and projected distribution (2085).
Source: Compiled from data in Hamann, A. and T. Wang. 2006. Potential effects of climate change on ecosystem and tree species distribution in British Columbia. Ecology 87: 2773-2786.
Note: The Alpine Tundra zone has been split into three zones since this analysis was done.
a A climate envelope describes the area of suitable climate for a species or ecosystem in terms of temperature and precipitation. Climate envelope models determine the current distribution of the species or ecosystem, then map the location of this same envelope under a climate change scenario.
b This shift is based primarily on a model prepared by the Canadian Centre for Climate Modeling and Analysis (the CGCM1gax general circulation model using the IS92a emission scenario). Although the modelling was done at the BEC variant level, the resulting information has been summarized at the zone level for these maps. Each of the maps represents a 30-year average. The 'current' map is an average for 1981-2010, and the 2085 map is an average for 2071-2100.
The key potential consequences of climate change to B.C.'s biodiversity are further summarized on the following pages, with descriptions of specific effects on different ecosystem types based on empirical information as well as modelling.
Species Of Conservation Concern
Although there could be some benefits for species of conservation concern associated with warm climates,939extinction may be expected for species and populations that are already threatened by small population size, loss of unique habitats and low reproduction/dispersal rates (among other factors).940 Climate change will likely exacerbate these existing stresses and conditions. Fragmentation of habitat and of populations in particular, makes biodiversity elements more vulnerable to increased variation in climate, especially extreme climate events. Increased fire activity may be of particular concern. Species associated with ecosystems that are exceptionally prone to climate change, such as the alpine tundra, likely will be at high risk of loss.
Figure 40: Potential shift in biogeoclimatic zones by 2085 due to climate change.
Source: Adapted from Hamann, A. and T. Wang. 2006. Potential effects of climate change on ecosystem and tree species distribution on British Columbia. Ecology 87: 2773-2786.
Note: The Arctic Tundra zone has been split into three zones since this analysis was done. 2085 represents the average of the period from 2071 to 2100.
Freshwater Environments
To date there has been no comprehensive evaluation of the potential effects of climate change on B.C.'s freshwater ecosystems, though impacts on salmon and other freshwater fish have received attention.941, 942 Major impacts must be expected because changes in temperature and precipitation (warmer and drier summers, for example) may work in tandem to create increased impacts and because aquatic environments are prone to extreme climatic events such as floods. Furthermore, human activity has degraded many aquatic systems. As freshwater systems are constrained by topography (i.e., unable to shift), connectivity of freshwater systems will be important to enable these systems to adjust.
Warmer ocean, lake and river water may be already impacting salmon and other fish populations by influencing migration timing and food availability and limiting use of river systems.943 Models indicate that temperatures will increase further and strong effects on salmon must be expected. This expectation is supported by the observed association between reduction in Fraser River sockeye populations and increasing river temperatures and changes to river flow volume and timing.944 Changes in runoff and other flow characteristics of streams are expected945 and may impact salmon spawning beds, either through erosion and sediment deposition at winter high flows and flood events or by exposing them during low water. In rainfall-driven streams, extended summer low-flow periods are expected, further increasing water temperature, favouring warm water species and altering community structure and functioning. In snowmeltand glacier-fed streams, the intensity and timing of freshet floods are expected to change. As a result of reduced snow cover and decline of glaciers, some river systems may become rainfall-driven, altering their ecology profoundly (see Section 2.5.2.3-D, p. 149).
Other measured effects include increased ocean acidity (see Text box 17, p. 129)946 and increased coastal water turbidity, which may reduce the availability of fish prey species for seabirds. With the increase in temperature and longer ice-free periods, lakes and streams that do not have current nutrient limitations may increase in productivity.947 Reduction in salmonid populations in river systems may decrease food for forest-dwellers such as bears and impact nutrient cycling and terrestrial food webs (see Section 2.5.1.3-F, p. 121).948
Paleoecological studies suggest not only changes in the composition of lake ecosystems because of warmer water,949 but also potential changes in the size and depth of small lakes.950 Reduced water volume clearly would result in alterations in shoreline and planktonic communities.
Wetlands
Wetlands are particularly vulnerable to climate change because the physical landscape that supports this land cover type is restricted.951 Generally, wetlands of cool, moist climates, such as bogs with stable hydrology, will be negatively impacted, whereas marshes with fluctuating water tables and higher nutrient levels will be favoured. Paleoecological evidence suggests that shallow-water interior wetlands are likely to dry up.952 Changes in wetlands will impact not only obligate species, but will have major consequences for the breeding and migration of birds. Increasing human demand for water will likely intensify the impacts of climate change.
Coastal Ecosystems
Global sea levels are rising at surprisingly high rates compared to model projections.953 Coastline ecosystems, such as intertidal communities, estuaries and salt marshes, and the species that use them, will be impacted by flooding, increased wave and storm activity and changes in sedimentation and erosion.954, 955 Rising water levels will squeeze lowland coastal habitats against natural and artificial barriers such as mountains and dikes. Sediments may bury coastal wetland surfaces. Saltwater intrusion will alter soil and water chemistry and lead to extirpation of freshwater plants, resulting in habitat loss for migrating birds. The erosive force of storm surges may breach natural protective barriers such as sand spits. High-energy intertidal ecosystems such as those of rocky headlands may have considerable resilience, whereas estuaries, especially those constrained by dikes on subsiding deltas (e.g., the Fraser River Delta) are at high risk of impact. Changes in stream hydrology will impact estuarine habitats through changes to water flow and sediment load resulting in alteration to nearshore productivity, such as in sites of nutrient upwelling. An increase in CO 2 and the resulting increase in ocean acidity (see Text box 17, p. 129) will affect the ability of crustaceans to develop shells, which could modify food webs.956
Alpine And Subalpine Parkland Ecosystems
Cold, high-elevation ecosystems are particularly vulnerable to climate change because of their restricted landscape position and elevational limits.957 Treelines were about 100 m higher during warmer intervals only 8,000 years ago.958 Increases in the length of the growing season, with warmer temperatures and reduced snow duration and snow pack (especially on the coast), will favour woody species, including trees. The climate envelope for alpine ecosystems may decrease by 60% by 2025 and 97% by 2085, with treelines (approximately equal to the lower boundary of the alpine zone) moving upslope by 168 m and 542 m, respectively.959 Alpine and subalpine patches in southern B.C. are small and especially vulnerable to climate change, as the land is mostly rock at the elevations where these ecosystems occur.
The subalpine Spruce-Willow-Birch biogeoclimatic zone climate envelope could largely disappear by 2055.960 However, the mountain temperature gradient is steep and alpine climates will likely persist, especially in northern B.C.
Northern And High-Altitude Spruce Forests
Climate impact modelling suggests a high risk for the transformation of northern and high-altitude spruce forests to ecosystems typical of southern B.C.961 A model of the future distribution of western redcedar suggests that large parts of northern B.C. will be suitable for this species.962 The climate envelope for the Sub-Boreal Spruce and Sub-Boreal Pine-Spruce biogeoclimatic zones is expected to be reduced by more than half by 2055 and more than 80% by 2085. The climate envelope for the B.C. version of the boreal forest (the Boreal White and Black Spruce biogeoclimatic zone) will remain stable through 2055, but decline by about half by 2085.
The current mountain pine beetle epidemic has already led to widespread changes in these forests (see Text box 16, p. 105), and other insects, such as the western spruce budworm (Choristoneura occidentalis) could also reach epidemic levels. The incidence of fire in northern coniferous forests is increasing and is projected to increase even more.963 Warming soil temperatures may be unfavourable to the growth of forest floor mosses, a key element of northern spruce forests. Changes in structure and composition are likely to have major impacts on ungulate populations.
Engelmann Spruce-Subalpine fir forests, at least in southern B.C., are a relatively recent development in response to the spread of cool and moist climates at mid to high elevations.964 They could be expected to decline in area with climate change. The Engelmann Spruce-Subalpine fir climate envelope is predicted to be stable until 2085, largely because increases in the north offset widespread losses in the south.965
Southern Dry Forests
Dry interior forest dominated by pine species or Douglas-fir likely covered a much larger area than today under the warm and dry climate of 8,000 to 6,000 years ago,966 a time when fires were also more frequent. These dry forests occurred notably where moist Interior Cedar-Hemlock forest occurs today. Climate impact models suggest that the climate envelopes for the Interior Douglas-fir and Ponderosa Pine zones will expand widely into areas currently occupied by northern spruce forest climates (i.e., northeast B.C.) by 2085. Insect epidemics will likely remain a threat. Data from the fossil record and impact models suggest grasslands may replace dry conifer forest at low to mid elevations in southern interior B.C.967, 968, 969 Upon disturbance, these forests may be at increased risk of invasion by alien species.
Coastal And Inland Temperate Rainforests
The fossil record indicates that major shifts in geographic range, and possibly in composition, can be expected for coastal and inland temperate rainforests under a warmer future climate,970 with Douglas-fir-dominated stands displacing western redcedar-hemlock stands in relatively dry sectors. Novel species combinations may be expected.971 In the driest portion of the coastal forest, expansion of the Garry oak's range is expected, as are increases in the abundance of some rare species such as Oregon ash.972 However, the Garry oak ecosystem may not increase, due to fragmentation and alien species. Rapid expansion in the Coastal Douglas-fir zone climate envelope may result in a 336% increase by 2085.973 The climate envelope of the Coastal Western Hemlock zone is projected to increase steadily in elevation at the cost of the subalpine Mountain Hemlock zone, which may be strongly impacted (79% decline by 2085).974 Drier summer conditions could reduce the suitability of coastal forests as habitat for mosses and other bryophytes.
The Interior Cedar-Hemlock zone climate envelope is also anticipated to increase, especially in central B.C.975 However, a projection for western redcedar shows widespread decline in southern B.C., accompanied by widespread expansion in the north.976 Paleoecological studies reveal that these forests arose in response to a cooling and moistening climate in the last two millennia.977, 978 Hence, a decline in area might be expected with warming.
Grasslands
The fossil record and impact models suggest that the grasslands climate envelope may expand enormously, more than for any other ecosystem type.979, 980, 981 Alien species may dominate new grasslands. Rare northern grasslands in the Boreal White and Black Spruce zone could decrease as a result of warmer, wetter conditions and encroachment by woody plants resulting from climate change.982
Alien Species
Alien species may expand as climate change modifies the frequency and intensity of extreme climatic events, resulting in a reduced resistance to alien species invasions,983 and therefore creating better opportunities for alien species to establish and expand.984 Climate change may expedite the colonization of wide areas by alien species in both the terrestrial and freshwater realms. For instance, alien warm-water fish species, such as smallmouth and largemouth bass (Micropterus dolomieu and M. salmoides) and yellow perch, may thrive as water temperatures increase.985 These species may out-compete and/or prey on cold-water native species. Similarly, increased frequency and magnitude of forest fires (and our responses to them) will create openings vulnerable to colonization by alien plants.
3.3.2 Agriculture
Agriculture consists of two forms of production: intensive and extensive. Intensive production systems have large labour and other capital costs (e.g., cultivation of field crops, orchard crops, horticultural crops, vineyards, feedlots), while extensive systems have much lower inputs (e.g., grazing). Intensive agriculture is generally located in areas of high ecosystem productivity where soils are the most fertile, such as valley bottoms and coastal floodplains. Typical activities associated with intensive agriculture include fertilization, tillage, annual planting and harvesting, pesticide application and irrigation. Extensive agriculture occurs mainly in grassland ecosystems and covers greater areas of land, but the activities are less intensive (e.g., rotational grazing).
Impacts of some agricultural activities occur through ecosystem conversion, ecosystem degradation, introduction of alien species and environmental contamination. Agricultural activities can also modify ecosystem processes. Ecosystem conversion occurs the most in areas with rich soil, such as floodplains and valley bottoms that are converted to intensive agricultural crops (e.g., berries, nurseries) or buildings (e.g., greenhouses). However, above the valley bottoms in the south Okanagan there was a 500% increase in the amount of land converted to vineyards between 1990 and 2005,986 contributing to the loss of the antelopebrush /needle-and-thread grass ecosystem (see Figure 9, p. 39). Once land has been converted from natural ecosystems to agriculture, some crops (e.g., vegetables, grains and grass) still provide food and habitat for wildlife. However, through agricultural intensification, many of the lands are converted to other uses, such as berry farms, nurseries and greenhouses, which reduce the value of the land to biodiversity. Table 27 shows a significant increase in these types of intensive agriculture uses in the Greater Vancouver Regional District (now known as Metro Vancouver).
Drainage of wetlands and upland areas can change hydrology, resulting in ecosystem degradation. The diversion of streams for water storage and irrigation may result in low flows for fish. Agriculture can also alter ecological processes in both terrestrial and freshwater realms through changes to soil, water and species composition by contamination from animal waste, fertilizer and pesticides, and the subsequent eutrophication of surface water from agricultural runoff987 and through planting of non-native plants such as hay crops. In addition, fragmentation of ecosystems occurs as more fences, buildings and roads are installed or built. Overgrazing can compact soil and reduce riparian areas, resulting in increased stream temperature and channel instability and invasion by alien species.988 Water withdrawal from streams for irrigation purposes can reduce stream flow, impacting fish, as well as reducing the volume of water in wetlands, which impacts species such as amphibians. The transport of alien species may also allow the introduction of disease.989
Table 27. Agricultural Land Use Within The Greater Vancouver Regional District Between 1981 And 2001.
| Type Of Use | Area (Ha) 1981 | Area (Ha) 2001 | Change Area (Ha) | Change % |
| Nurseries | 159 | 1,460 | 1,301 | 818% |
| Greenhouses | 45 | 282 | 237 | 527% |
| Buildings and woodlots | 2,261 | 7,179 | 4,918 | 218% |
| Berries and fruit | 1,445 | 3,940 | 2,495 | 173% |
| Grasses (grazing, hay, turf) | 12,240 | 19,204 | 6,964 | 57% |
| Vegetables | 5,685 | 6,737 | 1,052 | 19% |
| Grains | 1,370 | 1,255 | -115 | -8% |
| Total | 23,205 | 40,057 | 16,852 | 73% |
| Unmanaged land (idle) | 414 | 293 | -121 | -29% |
Source: Prepared for this report with data from the Census of Agriculture (1981 and 2001).
3.3.3 Forestry
Seventy percent of B.C.'s land is covered by forest (see Figure 7, p. 25), and timber has been harvested, or is expected to be harvested, from approximately 46% of B.C.'s forests;990 this excludes protected forests, other reserves and forests that are considered uneconomical for timber production. Specific forestry activities include building access roads, silviculture (harvest and re-establishment) and fire suppression. These activities can result in ecosystem degradation and disturbance. Forestry-related activities affect species and ecosystems in different ways, including fragmentation of habitat and disruption of movement corridors; simplification of forest communities; alteration of age-class distribution, tree species distribution and stand structure; and loss of key habitat elements such as wildlife trees (see Section 2.5.1.2-F, p. 108) and coarse woody debris (see Section 2.5.1.2-I, p. 113).991 Changing a forest from a complex of multiple tree species of different ages to a monoculture simplifies ecological communities. Herbicides applied during silviculture operations are toxic to some animal species and affect others by eliminating food plant species.992
An assessment of 3,199 B.C. vertebrate and vascular plant species and subspecies classified 41% as forestassociated, and 8% of these are of conservation concern.993 All of B.C.'s freshwater fish and amphibians are considered forest-associated,a as well as 75% of mammals and 60% of birds.b Most logging in B.C. takes place in the productive, easily accessible, low-elevation valleys or slopes where the majority of species also live. Many species (e.g., marbled murrelets and certain lichens and invertebrates) are known to rely on old, large trees and the oldest age classes of forests. 994, 995, 996, 997
a A forest-associated species is one with a measurable dependence on a forest ecosystem for any aspect of its life history.
b Includes subspecies and populations.
Figure 41 shows the annual timber harvest in B.C. between 1912 and 2006. About 40% of the province's land area is occupied by forests that are less than 140 years old, mostly due to a combination of logging, clearing and burning.998 Younger forests cover a greater proportion of the B.C. interior than of the coast, likely due to the greater frequency of fires in the interior, combined with the higher volume of forest harvesting in the interior since the mid 1970s.999 The prevalence of younger forests will increase in the interior as a result of the current mountain pine beetle infestation (see Text box 16, p. 105). These trends in harvest volume and age classes are reflected in a growing proportion of managed stands, which often have less biodiversity than the original forests.
Approximately 9% of the total land area of British Columbia has been logged since the 1970s (Table 28, Map 19). Although logging prior to this time is not reflected in the map or the table, it was significant in some areas of the province. The Coastal Douglas-fir zone was almost entirely logged in the early 1900s, and forests more than 100 years old in this zone now occupy only 4% of the area occupied 150 years ago.1000 Similarly, only 0.5% of the old forest that once dominated parts of the central Okanagan remains, now reduced to fragmented patches of less than 3 ha each.1001
Figure 41: Total timber harvest, 1912-2005/06 (private and Crown land).
Source: B.C. Ministry of Forests and Range. 2006. The State of British Columbia's Forests, 2006. Forest Practices Branch, Victoria, BC. Available at: www.for.gov.bc.ca/hfp/sof/2006/.
The biogeoclimatic zones with the greatest proportion logged since the 1970s are the Sub-boreal Spruce (23%), Interior Douglas-fir (22%) and Montane Spruce (21%). There has been little or no logging in relatively inaccessible parts of the coast, the Rocky Mountains and the northwest and north-central regions.
Table 28. Percent Of Land Logged In B.C. Since The 1970s By Biogeoclimatic Zone.
| Biogeoclimatic Zone | Percent Of Total Land Area Logged Since 1970s |
| Sub-boreal Spruce | 23% |
| Interior Douglas-fir | 22% |
| Montane Spruce | 22% |
| Interior Cedar-Hemlock | 22% |
| Sub-boreal Pine-Spruce | 17% |
| Coastal Western Hemlock | 14% |
| Ponderosa Pine | 8% |
| Engelmann Spruce-Subalpine Fir | 6% |
| Coastal Douglas-fir | 6% |
| Boreal White and Black Spruce | 5% |
| Mountain Hemlock | 2% |
| Spruce-Willow-Birch | <0.5% |
| Bunchgrass | <0.5% |
| Interior Mountain-heather Alpine | <0.5% |
| Coastal Mountain-heather Alpine | <0.5% |
| Boreal Altai Fescue Alpine | <0.5% |
| Province | 9% |
Source: Prepared for this report.
Note: Based on imagery taken between 1991 and 2001 that classified areas recently logged up to 20 years old (as well as other sources for logging since the images were taken). Logging that occurred more than 20 years before the images were taken is not included.
3.3.4 Urban And Rural Development
Human activities within this category are associated with residential, commercial and industrial development, sewage and solid waste disposal, and infrastructure for water and power supply. These activities result in ecosystem conversion, ecosystem degradation, environmental contamination, species mortality and increases in alien species. The most immediate impact of urban and rural development is the conversion of natural landscapes to buildings, parking lots and playing fields, resulting in the loss of species and ecosystems along with the impairment of ecosystem functions. While some activities do not result in complete ecosystem conversion, there can be significant degradation, such as habitat fragmentation, predation by domestic animals and disruption of surface water flow over impervious surfaces.1002 Runoff from impervious surfaces affects the hydrology of streams and impacts sediments and temperature in aquatic environments.1003, 1004
The infrastructure and activities associated with development can also create point and non-point source pollution, such as waste discharges into water bodies (e.g., Victoria's sewage discharge into the Strait of Juan de Fuca), airborne pollutants from factories, contamination of nearshore areas, pollution associated with automobile oil on roads and application of fertilizers and pesticides on residential properties.
Increases in the planting of alien species for landscaping, greater movement of people and goods both nationally and internationally, and increased disturbance of sites along roadways can facilitate the introduction of alien species.
Clearly, an increasing population negatively impacts biodiversity in many ways and, as the population increases, the impacts on biodiversity will continue. Since 1971, the province's population has almost doubled to 4.3 million and is expected to reach close to 6 million by 2031 (Figure 42). In the 2006 Canadian census, British Columbia was the third-fastest growing province in Canada, its population increasing by 5.3% between 2001 and 2006, compared to 4.9% between 1996 and 2001. This growth was concentrated in the lower mainland, eastern Vancouver Island and Okanagan areas, as well as in the northeast corner of the province (Figure 43).1005
Many impacts on biodiversity are associated with population size, but the location of growth is also a major factor. Within B.C., human population is concentrated where species richness is highest: the lower mainland, the east and south coasts of Vancouver Island, and the low-elevation lake and river valleys of the southern interior. The impacts to biodiversity are relatively permanent; even reductions in human population (experienced in some areas of the province) do not necessarily improve the status of biodiversity, since infrastructure such as roads and buildings remains. Given continued population growth in low-elevation areas, the impact of urban development on biodiversity is expected to intensify.
In addition to population growth and geographic location, the density of the growth is an important factor that impacts biodiversity. Since World War II, low-density housing has been the dominant form of residential development in North America creating urban and suburban sprawl and resulting in fragmentation of forests and farmland and impacts to both streams and wildlife.1006 The number of people living in each dwelling in B.C. is decreasing (from 2.62 persons in 1991, to 2.60 in 1996, and 2.50 in 2001).1007, 1008 This trend is occurring in all regions of B.C., leading to an escalation in the number of dwellings required to house the same population and therefore impacting biodiversity.
Urbanization creates large amounts of impervious surfaces: parking lots, building and roads. Instead of soaking into the ground, precipitation runs off the impervious surfaces and into storm drains. Recent research shows that stormwater-related impacts typically start to occur once the impervious percentage of a watershed reaches about 10%.1009 In B.C. examples of impervious area measurements include 4.6% in the French Creek watershed on Vancouver Island1010 and 48% in the Tilbury Industrial Area in the Municipality of Delta.1011 More than 2,725 watersheds were evaluated in the Georgia Basin-Puget Sound region between 1992 and 2000, and 58 of them showed an increase in impervious area of 2-19% of their total area (Figure 44).1012 Between 1990 and 2000, Vancouver created 67 km2 of impervious surfaces along the edges of existing urban areas or as infill within those areas.1013
Figure 42: Population growth for B.C. (1861-2006) with a projection to 2031.
Source: B.C. Stats. 2007. British Columbia Population 1867 to 2007. Available at: www.bcstats.gov.bc.ca/data/pop/pop/bc1867on.csv.
Figure 43: B.C. population change (selected areas), 1981-2001.
Source: Statistics Canada. 2006. Canadian Environmental Sustainability Indicators: Socio-Economic Information 2006, Revised. Statistics Canada Environment Accounts and Statistics Division, Ottawa, ON. Catalogue No. 16-253-XIE.
3.3.5 Transportation And Utility Corridors
This category of human activity includes the infrastructure and activities associated with the movement of people, commodities and information. Specific infrastructure includes sea ports and airports, and linear features such as roads, hydro and communications transmission corridors, seismic lines, pipelines and railways. These activities impact biodiversity through ecosystem conversion, ecosystem degradation and the introduction of alien species and species disturbance. The construction of ports and similar structures converts natural ecosystems to land cover that excludes species and ecosystems. Even relatively narrow roads through forest can produce marked edge effects that may have negative consequences for the function and diversity of these ecosystems.1014 There is also significant ecosystem degradation in the area beyond the actual feature. The construction of linear features alters hydrology in water courses and increases sedimentation, and can disconnect streams from floodplains and block aquatic species movement.
Figure 44: Change in impervious area in the Georgia Basin-Puget Sound region, 1992-2000.
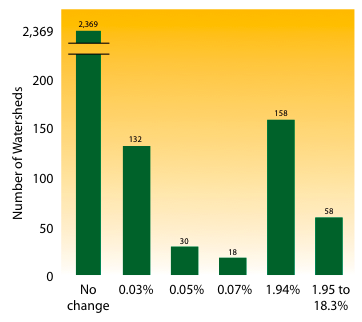
Source: U.S. Environmental Protection Agency. Puget Sound Georgia Basin Ecosystem Indicators: Urbanization and Forest Change. Available at: www.epa.gov/region10/psgb/indicators/urbaniz_forest_change/what/.
Roads and other linear features impede the movement of native species, facilitate invasion by alien species and alter predator-prey relationships. Specifically, roads can fragment ranges, populations, habitats and ecosystems,1015, 1016, 1017 and reduce gene flow, resulting in loss of genetic diversity.1018 Roads can increase access to previously inaccessible areas, resulting in increased road kill of wildlife and increased access for legal and illegal fishing and hunting. Both on-road traffic and off-road vehicles create disturbance, which can alter species behaviour. Roads also facilitate ecosystem conversion, ecosystem degradation, alien species invasion and environmental contamination.1019, 1020
The ecological impacts of roads can affect approximately 20 times the land area that the roads actually cover.1021 Hence roads and other linear features are a useful index for the cumulative impact on biodiversity. Between 1988 and 2000, road length in B.C. increased by 48%, from an estimated 387,000 km to more than 570,000 km (Figure 45).1022 By 2005, total road length was 702,574 km, a 23% increase in just five years, and an 82% increase since 1988. This is a conservative estimate of the expansion of linear features in B.C., as it does not include seismic lines.
Table 29 shows density of roads and other linear features across B.C.'s biogeoclimatic zones, including main and secondary roads, forest access roads, transmission lines, railways, seismic lines and pipelines. The highest densities of roads are found in the Coastal Douglas-fir, Ponderosa Pine, Bunchgrass and Interior Douglas-fir zones, all zones of conservation concern (see Section 2.2.1.1, p. 30).1023
The density of roads and other linear features varies across the province, with the greatest densities in the northeast, central interior and southwest (including Vancouver Island) and in major valleys in the southern interior (Map 20). Seventy-six percent of B.C.'s roads are forest access roads. The area of high density in the northeast corner of the province is largely due to seismic lines used for oil and gas exploration. Although seismic lines are allowed to revert back to forest after use, thousands of kilometres of new lines are cut each year.1024 Large tracts of mountainous land in the northwest of the province and along the central coast are relatively free of disturbance from roads.1025
Table 29. Presence Of Roads Or Other Linear Features In B.C. By Biogeoclimatic Zone.
| Biogeoclimatic Zone | Road Density (Km/Km2) | Percent Of 1-Ha Units With Roads Present |
| Coastal Douglas-fir | 4.7 | 38% |
| Ponderosa Pine | 3.0 | 28% |
| Bunchgrass | 2.8 | 25% |
| Interior Douglas-fir | 2.1 | 22% |
| Boreal White and Black Spruce | 1.4 | 15% |
| Interior Cedar-Hemlock | 1.3 | 14% |
| Sub-boreal Spruce | 1.3 | 13% |
| Montane Spruce | 1.3 | 14% |
| Sub-boreal Pine-Spruce | 1.1 | 12% |
| Coastal Western Hemlock | 0.9 | 9% |
| Engelmann Spruce-Subalpine Fir | 0.3 | 3% |
| Mountain Hemlock | 0.1 | 1% |
| Spruce-Willow-Birch | 0.1 | 1% |
| Boreal Altai Fescue Alpine | <0.1 | <1% |
| Interior Mountain-heather Alpine | <0.1 | <1% |
| Coastal Mountain-heather Alpine | 0.0 | 0% |
| Province | 8.0% |
Source: Prepared for this report.
Note: Density and percent Figures include other linear features.
Figure 45: Length of roads in B.C. in 1988, 2000 and 2005.
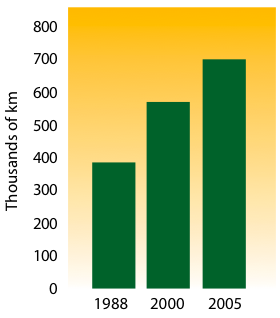
Source: B.C. Ministry of Environment. 2007. Environmental Trends 2007. State of Environment Reporting Office, Victoria, BC. Available at: www.env.gov.bc.ca/soe/et07/.
Note: Includes all main and secondary roads, including paved, unpaved, and rough roads, forest service roads, and other forest and non-forest roads.
3.3.6 Water Development
Water development activities include the use of water, as well as the associated infrastructure, such as dams. In B.C., the allocation of water is governed by water licenses and short-term use approvals that are issued for a variety of purposes, such as domestic or municipal water supply, irrigation, industrial and commercial uses, mining, power production, oil and gas drilling and injection, and water storage.1026 Table 30 (p. 204) shows water allocation for selected purposes in B.C.'s nine Major Drainage Areas.
The diversion of water from lakes can cause excessive drawdown of surface water sources with consequent disruption of aquatic and riparian habitat.1027 In rivers, water diversions reduce flow and lower water levels, which can create barriers to movement of fish and other aquatic species.1028, 1029 Withdrawal of water from streams can affect the biological carrying capacity of the stream, cause changes in temperatures and alter life history stages of aquatic organisms, depending on when and how much water is removed. Fish and other animals are sometimes trapped or die when drawn into diversion channels or other in-stream structures, such as turbines. Wastewater from industrial uses is often returned to the source water body with contaminants and/or a significant change in temperature.
There are about 30,000 licenses for water diversiona in B.C., for a total permitted volume of more than 21 billion kL per year; this does not include water diverted for power production or water storage for dams, or allocations for conservation purposes. According to 1999 data, over 97% of water licensed is used for power production, including storage, while the remaining 3% is used for drinking water, agriculture and consumptive industrial and commercial uses.1030 The total volume of surface water licenses doubled between 1960 and 1990 (Figure 46).
a Diversion includes the following uses: domestic, waterworks (e.g., sewage ponds, local water authorities), industry, institution, agriculture, and other.
In recent years, water restrictions have been registered against streams when the demand for licenses exceeds the capacity of the water supply.1031 Water restrictions increased seven-fold between the 1960s and the 1990s. Between half and two-thirds of available surface water in populated regions of B.C. has been allocated (see Text box 18, p. 164).1032
Dams are built primarily for hydroelectric power generation, flood control and irrigation. In B.C., mountainous terrain, high-volume rivers and long, narrow valleys make dam construction relatively easy. Ninety percent of B.C.'s electricity is generated by hydroelectric dams, and more than 70% of this is produced by dams on the Peace and Columbia rivers.1033 Of the 2,200 registered dams in British Columbia, 44 are for generating hydroelectric power, including 13 on the Columbia River, two on the Peace River, 11 in the lower mainland, seven on Vancouver Island and two on the mainland coast.1034, 1035 The thousands of other dams are generally small and used for domestic water sources, run-of-river power production and local industrial uses. Like the larger dams, these smaller dams can also impede fish passage, trap nutrients and alter flow regimes. Recent interest in run-of-river projects has raised questions about the cumulative impacts of these often small operations. These include water diversion and increased roads and transmission lines.
Impacts from dams result in both ecosystem conversion and degradation related to infrastructure, upstream reservoirs and degradation of downstream ecosystems. The inundation of a reservoir upstream of a dam results in ecosystem conversion through the extirpation of riparian and valley-bottom habitats, which typically support high levels of biodiversity.1036 Besides decreasing biodiversity in adjacent riparian plant communities,1037 flooded riparian vegetation can be a source of methane and CO 2, both greenhouse gases that contribute to climate change. 1038 Reservoirs slow the velocity of the water, trapping sediments and nutrients that normally deposit in estuaries and deltas downstream and building up on the bottom of the reservoir.1039 Many species have difficulty adjusting to the sometimes daily fluctuating water levels in a reservoir, and aquatic biodiversity is lower in a reservoir than in a lake of similar size and location (see Section 2.5.1.3-C, p. 116).
Dams also create significant ecosystem degradation by hampering the movement of migratory and anadromous fish species (which reduces the transfer of marine-derived nutrients into interior ecosystems), changing turbidity and sediment levels to which species and ecosystems are adapted, disrupting normal processes of river channel scouring and silt deposition, preventing normal downstream movement of large woody debris, changing water temperature and oxygen conditions, providing habitat for alien species and creating unstable, early seral communities along shorelines. A dam typically decreases the annual flood below the dam and may increase flow during the summer so that the river no longer deposits sediments downstream. Decreased delivery of water and nutrients communities along shorelines. A dam typically decreases the annual flood below the dam and may increase flow during the summer so that the river no longer deposits sediments downstream. Decreased delivery of water and nutrients to downstream ecosystems, such as marshes and riparian areas, can cause a shift to species that are adapted to drier conditions. Water that flows through turbines into a river is colder and less oxygenated, because it originates from deep in the reservoir and does not mix with surface air. Vegetation, wildlife and fish populations can be altered for hundreds of kilometres downstream.1040
Figure 46: Trends in surface water licensing in B.C.
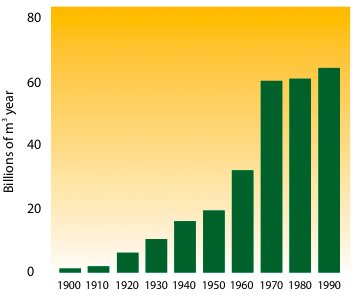
Source: B.C. Ministry of Environment, Lands and Parks. 2000. Environmental Trends in British Columbia 2000. State of Environment Reporting Office, Victoria, BC. 54pp. Available at: www.env.gov.bc.ca/soerpt/files_to_link/etrends-2000.pdf.
The Major Drainage Areas in B.C. that are most significantly affected by dams are those of the Columbia, Coastal, McKenzie and Fraser rivers and, less significantly, the Skeena River. A dam can influence extensive areas of the upstream watershed (see Map 21). Some river systems in B.C. are affected by dams built outside the province.
Table 30. Surface Water Allocation In B.C. By Major Drainage Area.
| Major Drainage Area | Volume Of Licensed Water Allocation (Kilolitres/Year) |
| Fraser | 10,617,165,159 |
| Coastal | 6,960,674,550 |
| Columbia | 3,191,406,652 |
| Skeena | 547,689,512 |
| Mackenzie | 393,667,691 |
| Stikine | 1,002,531 |
| Nass | 816,950 |
| Yukon | 816,924 |
| Taku | 27,990 |
| Provincial total | 21,713,267,959 |
Source: Prepared for this report based on data from the B.C. Ministry of Environment.
Note: This excludes water storage, diversion for dams and allocations for conservation purposes.
3.3.7 Oil And Gas
Terrestrial oil and gas development includes exploration, extraction and transportation activities, each with their own set of impacts on biodiversity. Primary and secondary impacts of oil and gas extraction include ecosystem conversion, ecosystem degradation (including fragmentation), species disturbance, environmental contamination of soil, water and air, soil compaction and erosion and sedimentation of waterways.1041, 1042 Secondary impacts, such as the construction of roads and seismic lines and the development of settlements and infrastructure to support workers, can have significant effects. Oil and gas in B.C. are high in sulphur, and long-term wind deposition of sulphur on vegetation or soil can impair ecosystem functioning through reduced diversity of species and dramatically reduced foliage cover.1043
At present, most activities associated with petroleum or natural gas extraction in B.C. take place in the relatively flat, rolling plain in the northeast corner of the province (see Map 22, p. 208), an extension of the interior plains of Alberta. There are currently more than 32,000 oil and gas facilities, including wells, in the province, with most of the sites concentrated in the Boreal White and Black Spruce biogeoclimatic zone (Table 31).
Table 31. Density Of Oil And Gas Sites In B.C. By Biogeoclimatic Zone.
| Biogeoclimatic Zone | Density (Number Of Sites/1,000 Km2) |
| Boreal White and Black Spruce | 196 |
| Engelmann Spruce-Subalpine Fir | 3 |
| Coastal Douglas-fir | 2 |
| Montane Spruce | 2 |
| Spruce-Willow-Birch | 2 |
| Sub-boreal Spruce | 1 |
| Interior Douglas-fir | <1 |
| Interior Cedar-Hemlock | <1 |
| Sub-boreal Pine-Spruce | <1 |
| Coastal Western Hemlock | <1 |
| Ponderosa Pine | <1 |
| Mountain Hemlock | <1 |
| Bunchgrass | <1 |
| Interior Mountain-heather Alpine | <1 |
| Coastal Mountain-heather Alpine | <1 |
| Boreal Altai Fescue Alpine | <1 |
Source: Prepared for this report.
3.3.8 Recreation
British Columbia is known for its outdoor recreation opportunities, and recreational activities are considered among the human activities most likely to have an increased impact on biodiversity in the future.1044 Impacts from recreation occur year-round, but are not equal throughout the province or within the terrestrial and freshwater realms. Participation in motorized backcountry recreation, especially snowmobiling, is increasing.1045, 1046 Since 1995, the retail sale of recreational off-highway vehicles has risen by 350% and is continuing to grow.1047
Motorized recreation is often in conflict with wildlife values, since high-quality wildlife habitat, such as ungulate winter range or alpine meadows, has attributes of value to motorized recreationists.1048 Impacts from snowmobiling, heli-skiing, snow-cat skiing and backcountry skiing have been observed on mountain caribou.1049 Of particular concern is habitat displacement from late winter foraging areas in response to snowmobiling.1050 Hard-packed trails also allow predators to reach subalpine foraging areas, increasing predation on mountain caribou.1051 Responses of ungulates to helicopters vary according to species, level of activity, season and quality of nearby cover, as well as the aircraft's altitude and distance from the animal.1052
Recreational impacts include trampling of vegetation, introduction and spread of alien species, disturbance of wildlife, sedimentation of streams or wetlands, and legal and illegal hunting, fishing and collecting (e.g., mushroom and berry picking). Irresponsible motorized vehicle recreation in natural ecosystems can result in soil erosion, noise pollution, air and water pollution, damage to vegetation, litter, and fire hazards.1053 Noise from the motors of vehicles such as helicopters, airplanes and snowmobiles can disrupt denning, nesting, dispersal and mating behaviour1054 and drive animals away from their preferred habitats, causing stress and expenditure of energy. As well, exhaust from motorized vehicles results in localized environmental contamination.1055
Activities associated with recreation also have significant impacts in the freshwater realm, particularly when lakes are altered to improve fishing opportunities. Some previously fishless lakes and ponds have been poisoned and then aerated to improve the survival of introduced game fish, which are generally predatory (see Section 2.5.2.3-G, p. 153). Predatory fish, such as trout, forage on amphibian eggs and larvae and have resulted in the loss of some tiger salamander breeding populations.1056, 1057 Introduced predatory fish may be responsible for numerous amphibian population declines and local extirpations, as well as changes in the structure of amphibian communities.1058 Trout introductions may fragment and isolate populations of amphibian species and reduce the ability of amphibians to move from lake to lake.1059 The introduction of fish can also result in behavioural changes in lake invertebrates, causing them to become less active and seek refuge more often,1060 affecting their availability as prey, as well as the primary and secondary trophic communities.1061
Introduction of new fish species into lakes that already contain fish can also impact biodiversity. For example, the introduction of the brown bullhead (Ameiurus nebulosus) caused the extinction of the Hadley Lake benthic and limnetic sticklebacks.1062
3.3.9 Grazing
Roughly 90% of British Columbia's remaining grasslands are grazed by domestic livestock, either through deeded private rangelands, grazing tenures on provincial Crown land or grazing regimes on First Nations land.1063 Grazing also affects riparian areas associated with grasslands, as well as some alpine and forested ecosystems. Grasslands and associated wetlands represent a tiny portion of the province's land base, but have very high levels of biodiversity. Grasslands cover less than 1% of the province's land base, but provide critical habitat for more than 30% of B.C.'s terrestrial species of conservation concern.1064
The most significant impacts of livestock grazing are ecosystem degradation, ecosystem conversion, and the introduction and spread of alien species. In B.C., grazing primarily results in ecosystem degradation. Conversion of grasslands or other native ecosystems to cultivated pastures affects only a small proportion of the land base affected by grazing.1065 Poor management practices, such as overgrazing and continuous grazing, degrade native plant communities and reduce wildlife habitat; in some cases, riparian vegetation is completely eliminated.1066
Grazing by wild ungulates can also impact biodiversity. For example, in the East Kootenay Trench, combined grazing by domestic livestock and wild ungulates (bighorn sheep, elk, white-tailed deer and mule deer) has resulted in significant pressure on the area's open grasslands. In the Peace region, bison probably played a role historically in shaping aspen parkland and grassland ecosystems, but the extent of their influence is not well understood.1067
3.3.10 Industrial Operations
Industrial operations refers to infrastructure and activities associated with large production facilities, such as factories, pulp and paper mills, refineries and smelters. The most significant impact of industrial operations is environmental contamination. Other impacts include ecosystem degradation, species disturbance and species mortality.1068 Water development impacts associated with industry are discussed in Section 3.3.6 (p. 201).
Numerous substances that have deleterious biophysical effects are currently released into the environment by industrial operations or were released in the past and are now no longer used, yet continue to be present (see Section 3.2.4, p. 169). These contaminants include toxic biochemicals, heavy metals, persistent organic pollutants, airborne fine particulates, excess nutrients released into aquatic environments (e.g., nitrogen or phosphorus) and pharmaceuticals.1069 The National Pollutant Release Inventory tracks the release, disposal and recycling of more than 300 pollutants by industrial, commercial and institutional facilities in Canada. In 2005, the 12 toxic pollutants discharged on-site in the largest quantities in B.C. were: hydrogen sulphide, sulphur dioxide, ammonia, methanol, hydrochloric acid, manganese, nitrate, styrene, hydrogen fluoride, zinc, chlorine dioxide and sulphuric acid. Discharges include unintentional spills and leaks, intentional releases (e.g., emissions to air from stacks, discharges to surface waters) and on-site disposal within the boundaries of the facility site (e.g., to landfills, underground injection).1070
3.3.11 Mining
Mining includes all infrastructure and activities associated with the extraction of geological materials, such as coal, metals, gems, construction aggregates, clay, shale and dimension stone. Impacts include surface and subsurface soil disturbance; aquatic, terrestrial and atmospheric pollution; erosion; and sedimentation from overburden and waste rock disposal.
Mining operations often result in ecosystem degradation or conversion, but only affect a relatively small portion of the provincial land base. Exploration activities have a larger footprint. Freshwater ecosystems are generally more affected by ecosystem conversion and degradation than are terrestrial ecosystems.1071 Mines are also major freshwater users and their wastewater often contains contaminants when returned to the source water body. Approximately 60 decommissioned B.C. mines present pollution issues of toxic metal leaching (copper, zinc and cadmium are typical examples) and acid rock drainage into the environment.1072
Gravel pits facilitate the dispersal of alien plant species because many of these species thrive in disturbed sites and because materials are continuously being moved in and out of these sites and along road corridors.1073
3.3.12 Aquaculture
Three main species groups are currently cultured in B.C. waters: salmon and other finfish; shellfish; and marine plants. Operations that take place in marine waters (e.g., salmon farming, deep-water shellfish farming, offshore marine plant cultivation) are outside the scope of this report.
Shellfish species that are cultivated in intertidal and estuarine ecosystems include clams and oysters (the latter are also cultivated in deep-water systems). In B.C., freshwater finfish aquaculture occurs primarily on private land and encompasses commercial enterprises such as salmon and trout hatcheries, trout farms and fee-fishing operations. About 34 small-scale farms raise rainbow trout (Oncorhynchus mykiss) in B.C. and a few facilities raise other freshwater species, such as tilapia (Oreochromis niloticus), carp (Cyprinus carpio) and signal crayfish (Pacifastacus leniusculus), in land-based lakes, ponds or tank operations.1074
The primary impact of shellfish and finfish aquaculture is introduction of alien species, since many cultivated species are non-native. Two of the province's leading shellfish aquaculture species, the Pacific oyster and Manila clam, were both introduced to B.C. waters in the early 1900s and have since greatly expanded their range (see Text box 19, p. 168). Freshwater hatcheries and fish farms and some shellfish aquaculture operations impact biodiversity through ecosystem degradation (e.g., habitat modification, installation of netting). Environmental contamination and direct mortality of species that prey on aquaculture stocks are also potential impacts.1075
3.4 Data Gaps
3.4.1 General
A threats framework that better integrates both terrestrial and freshwater activities and stresses is required. The current threats framework, based on the IUCN definitions, works well for the terrestrial realm, but has limited application in the freshwater realm, since many impacts are categorized as degradation. An additional descriptor labelled 'Mechanism' could be added. For example a 'stress' of hydrological alteration would include several 'mechanisms' such as land cover conversion, water withdrawal or channelization, all of which derive from several 'sources' (e.g. agriculture, urban development).
Data gaps include the time lag to document trends for impacts that can occur quickly (e.g., seismic lines) and the status and trends of all human activities and stresses. Land cover mapping (i.e., Baseline Thematic Mapping) and road data are out of date. Forest harvesting data are fragmented and not available for dates prior to the 1970s. The specific effects of many stresses on B.C.'s biodiversity are not well understood. The interaction between many stressors (i.e., cumulative effects) and the responses by elements of biodiversity are not well documented.
3.4.2 Climate Change
The examination of impacts of climate change is in its early stages. Some of the key gaps include: observation programs for climate-sensitive biodiversity attributes; climate data from sparsely populated, but biologically important regions, such as northern B.C. and the montane and alpine zones; and hydrometric data. There is also a lack of regional climate models. The relationship between climate variables and the geographical distribution of key ecological processes, ecosystems and species, especially climate-sensitive indicator species,a is not well understood.
a An indicator species is a species whose status provides information on the overall condition of the ecosystem and of other species in that ecosystem.